
Numbers don’t just decorate a scoreboard — they explain it the Women’s World Cup Final.
The 2025 Women’s World Cup semi-final between India and Australia produced figures that defined pressure, precision, and history.
From towering totals to record-breaking chases, every column of data tells part of the story. Let’s unpack how the digits behind the drama reveal why this clash will be studied for years.
Batting statistics – Women’s World Cup Final
Bat first, post big. That was Australia’s plan — and they nearly executed it perfectly.
They racked up 338 runs, driven by Litchfield (119), Perry (77) and Gardner (63) — a model of top-order consistency.
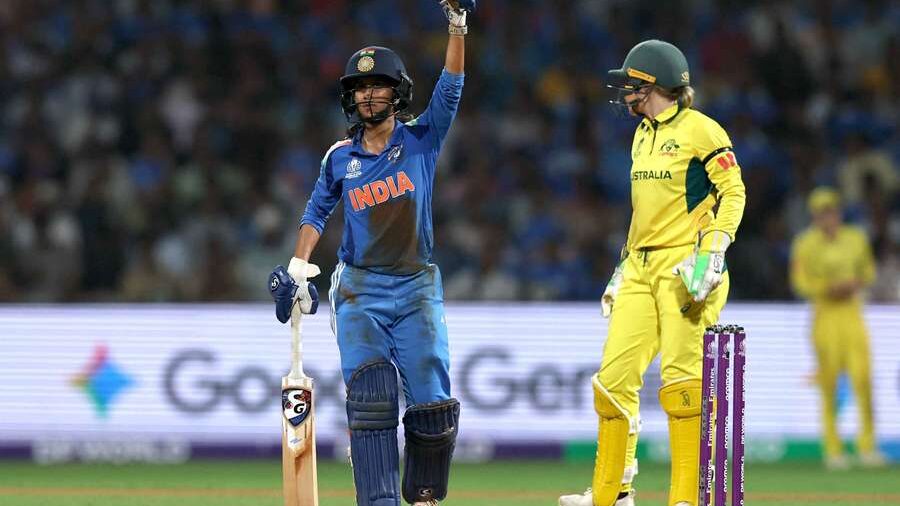
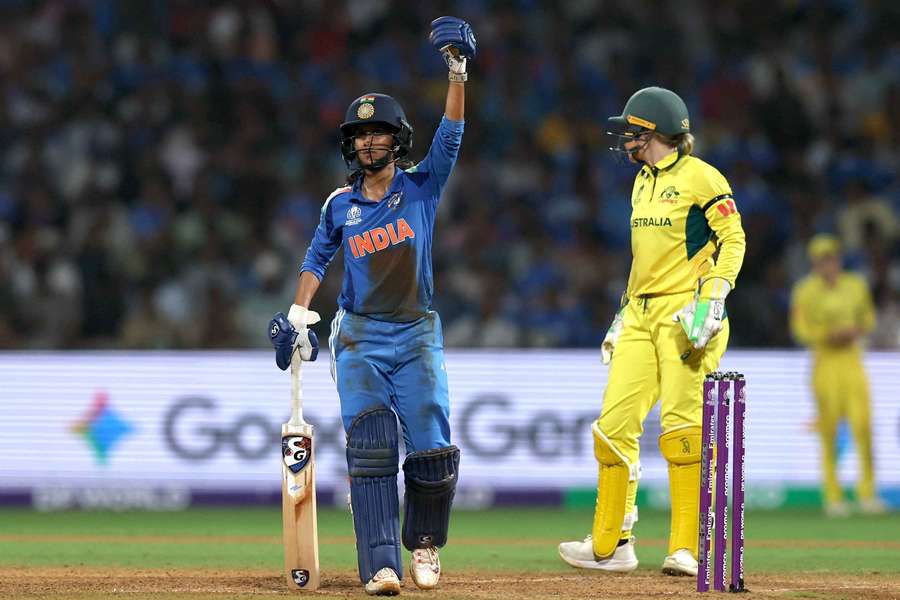
Then came India’s reply. *Rodrigues (127 ) and Kaur (89) turned an intimidating chase into a masterclass. Their calm rotations and clinical shot-making helped India reach 339 runs, setting a new record for the highest successful chase in Women’s ODI history.
Batting wasn’t just dominant — it was revolutionary.
Bowling & fielding – where matches were won or lost
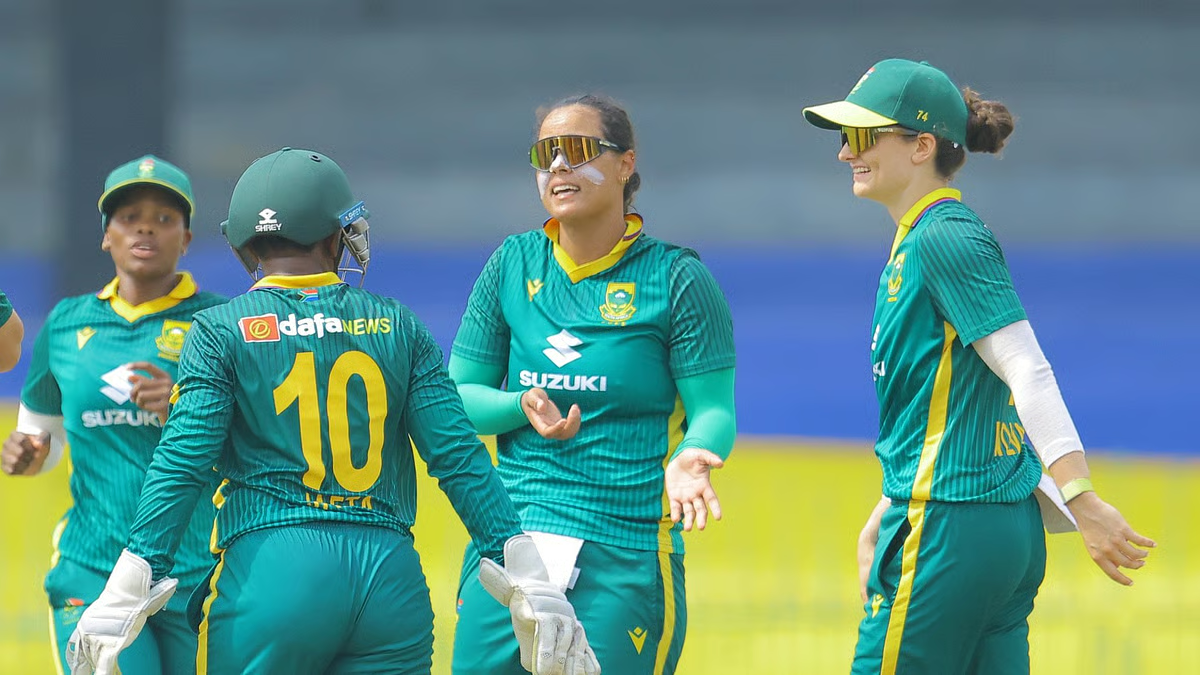
Both bowling attacks struggled under the lights, but execution made the difference.
Australia’s pacers started sharp, swinging early, yet their death-over economy climbed above 8 runs per over, undoing earlier control.
India’s bowlers showed discipline late, using slower deliveries and tight lines to limit boundaries.
Fielding proved decisive. Australia’s dropped catch of Rodrigues shifted momentum completely 【The Indian Express】. One mistake, one turning point — that’s modern cricket’s reality.
Partnership data – Women’s World Cup Final
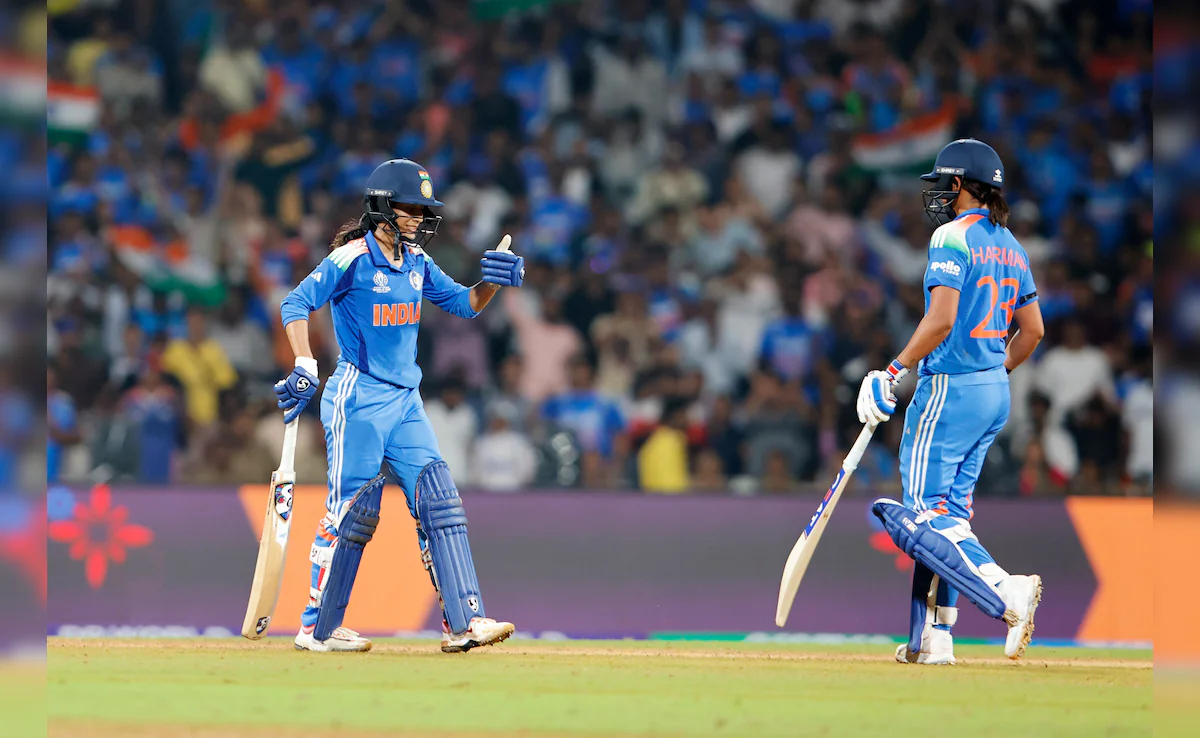
Cricket thrives on partnerships, and this match delivered a gem.
The 167-run stand between Rodrigues and Kaur was the game’s spine 【ESPN Cricinfo】.
It transformed early tension into belief and showed that composure can dismantle even the best bowling attacks.
By contrast, Australia’s mid-order partnerships wobbled after early dominance, leaving late overs without momentum. Numbers prove what eyes saw — India won through connection, not chaos.
Women’s World Cup Final : Comparison vs past semi-finals

Historically, women’s semi-finals have averaged around 230–260 runs per team.
This match smashed those ceilings, combining 676 runs total — the highest aggregate ever in a Women’s World Cup knockout.
It also featured the first 300-plus successful chase in the tournament’s history.
In statistical terms, it redefined what’s possible.
Comparing past data, no semi-final has matched this blend of pace, skill, and composure.
It’s the benchmark every future team will measure against.
What the numbers say about performance trends in women’s cricket
The trend is clear: offence is evolving.
Batting depth has increased, strike rates are climbing, and teams are confident chasing even the biggest totals.
Average innings scores in global tournaments have risen steadily over the past five years.
The 2025 semi-final merely confirmed the shift — from conservative strategies to fearless execution.
As fitness, analytics, and mental-conditioning programs expand, we’ll see even higher benchmarks in the coming seasons.
Key Stats from the Semi-Final : Women’s World Cup Final
| Metric | Result | Context / Record |
|---|---|---|
| Highest successful chase (Women’s ODI) | 339 runs by India 【Reuters】 | New record – historic milestone |
| Partnership for 3rd wicket (India) | ~167 runs Rodrigues & Kaur 【ESPN Cricinfo】 | Core to the chase |
| Australia total | 338 runs all out 【ESPN Cricinfo】 | Excellent total – still not enough |
For stat-minded fans, this semi-final is pure data gold.
It combined record chases, massive partnerships, and proof that women’s cricket has entered a new offensive era.
The numbers aren’t just historical markers — they’re signposts to where the sport is heading: faster, bolder, and more balanced between bat and ball.
Keep this scorecard bookmarked. It’s the start of a new statistical chapter.


